
How to Measure ROI from GEO: A 2026 Framework for the Invisible Funnel
How to Measure ROI from GEO: A 2026 Framework for the Invisible Funnel
Learn the GEO ROI measurement for LLM-driven buying journeys. Includes the formula, the metrics that matter, and where standard marketing math breaks.
Haritha Kadapa

Highlights
GEO ROI is essential for modern marketing: Marketing leaders must measure ROI from GEO to understand how AI visibility impacts leads, conversions, and revenue. AI search influences a large part of the buyer journey.
AI visibility extends beyond click-based metrics: GEO focuses on impressions, mentions, and citations in AI responses. These signals show how often a brand becomes part of the answer.
The invisible funnel shapes buyer decisions: Users interact with AI platforms before visiting websites. This hidden journey drives awareness, consideration, and conversions.
A structured framework enables GEO ROI measurement: Define KPIs, benchmark visibility, assign attribution, implement tracking, analyze performance, and optimize continuously. This step-by-step process connects AI visibility to business outcomes.
Small gains in AI visibility drive high returns: Even modest improvements can increase leads and pipeline. With proper tracking, businesses can clearly link GEO investment to ROI.
AI responses from platforms like ChatGPT, Perplexity, and Google AI Overviews now handle an estimated 14 billion searches per month, a figure that has grown 5 times in the last 2 years. Marketing leaders must measure return on investment (ROI) from Generative Engine Optimization (GEO) to justify investments and validate performance.
Many measurement frameworks for GEO are similar: they define KPIs, establish a baseline, perform attribution, track results, and optimize. While this approach is not incorrect, it is not particularly helpful. It fails to clarify why GEO is challenging to measure and does not provide satisfactory answers for a CFO who wants to understand what a monthly expense of $15,000 actually delivers.
This article provides a practical framework for tracking GEO ROI metrics, explains where the standard ROI formula breaks down for GEO, what to measure instead, and how to put a defensible number against the spend.
What ROI means in GEO
Return on Investment (ROI) for GEO quantifies the gains from making your brand visible in AI search versus the cost of those efforts. In other words, ROI from GEO means measuring how AI search visibility translates into business outcomes: leads, conversions, brand awareness, or cost savings.
GEO investments are reaching a large audience. Traditional analytics fall short of measuring this because GEO gains are often indirect. Instead of click-throughs, GEO metrics include AI-generated impressions, brand mentions, and citations. The benefit is being cited as a source in an AI answer, effectively becoming the “answer” to a user’s question. ROI must capture these non-click interactions.
For example, a ‘gain’ might be new customers discovering your brand through ChatGPT responses, while the ‘investment’ includes content creation, optimization, and time for strategy.
Why measuring ROI from GEO is critical in 2026
Most GEO impact is invisible in traditional analytics.
A typical buyer journey now looks like this: a user asks an AI platform for recommendations, reads the response, asks follow-up questions, and forms an opinion, without clicking a single link. Weeks later, they search your brand name and convert. Analytics credits branded search but not the AI interaction that influenced the decision. This is the invisible funnel.
Standard ROI models assume:
A click happens
The journey is trackable
Attribution is visible
GEO breaks all three assumptions of standard ROI:
The first click often doesn't happen:
Many AI interactions do not result in an immediate website visit. Users often form an opinion first and may visit the brand's website weeks later. Analytics tools credit this as “organic - branded,” but the efforts that contributed to reaching that answer are not recognized.
Attribution windows are wrong:
GEO influence often happens before any trackable interaction exists. It shows up as a branded search lift two or three months later.
The unit of value is not a keyword:
In GEO, brands do not rank for keywords; they compete for intent clusters (sets of related buyer queries). You are either the brand or the model names when those prompts run, or you are not. There is no page two to settle for.
See the four types of intent, each reflecting a distinct user motivation and buyer journey stage.
If you measure GEO like paid search or SEO (Search Engine Optimization), it will appear ineffective. The issue is not performance; it is measurement.
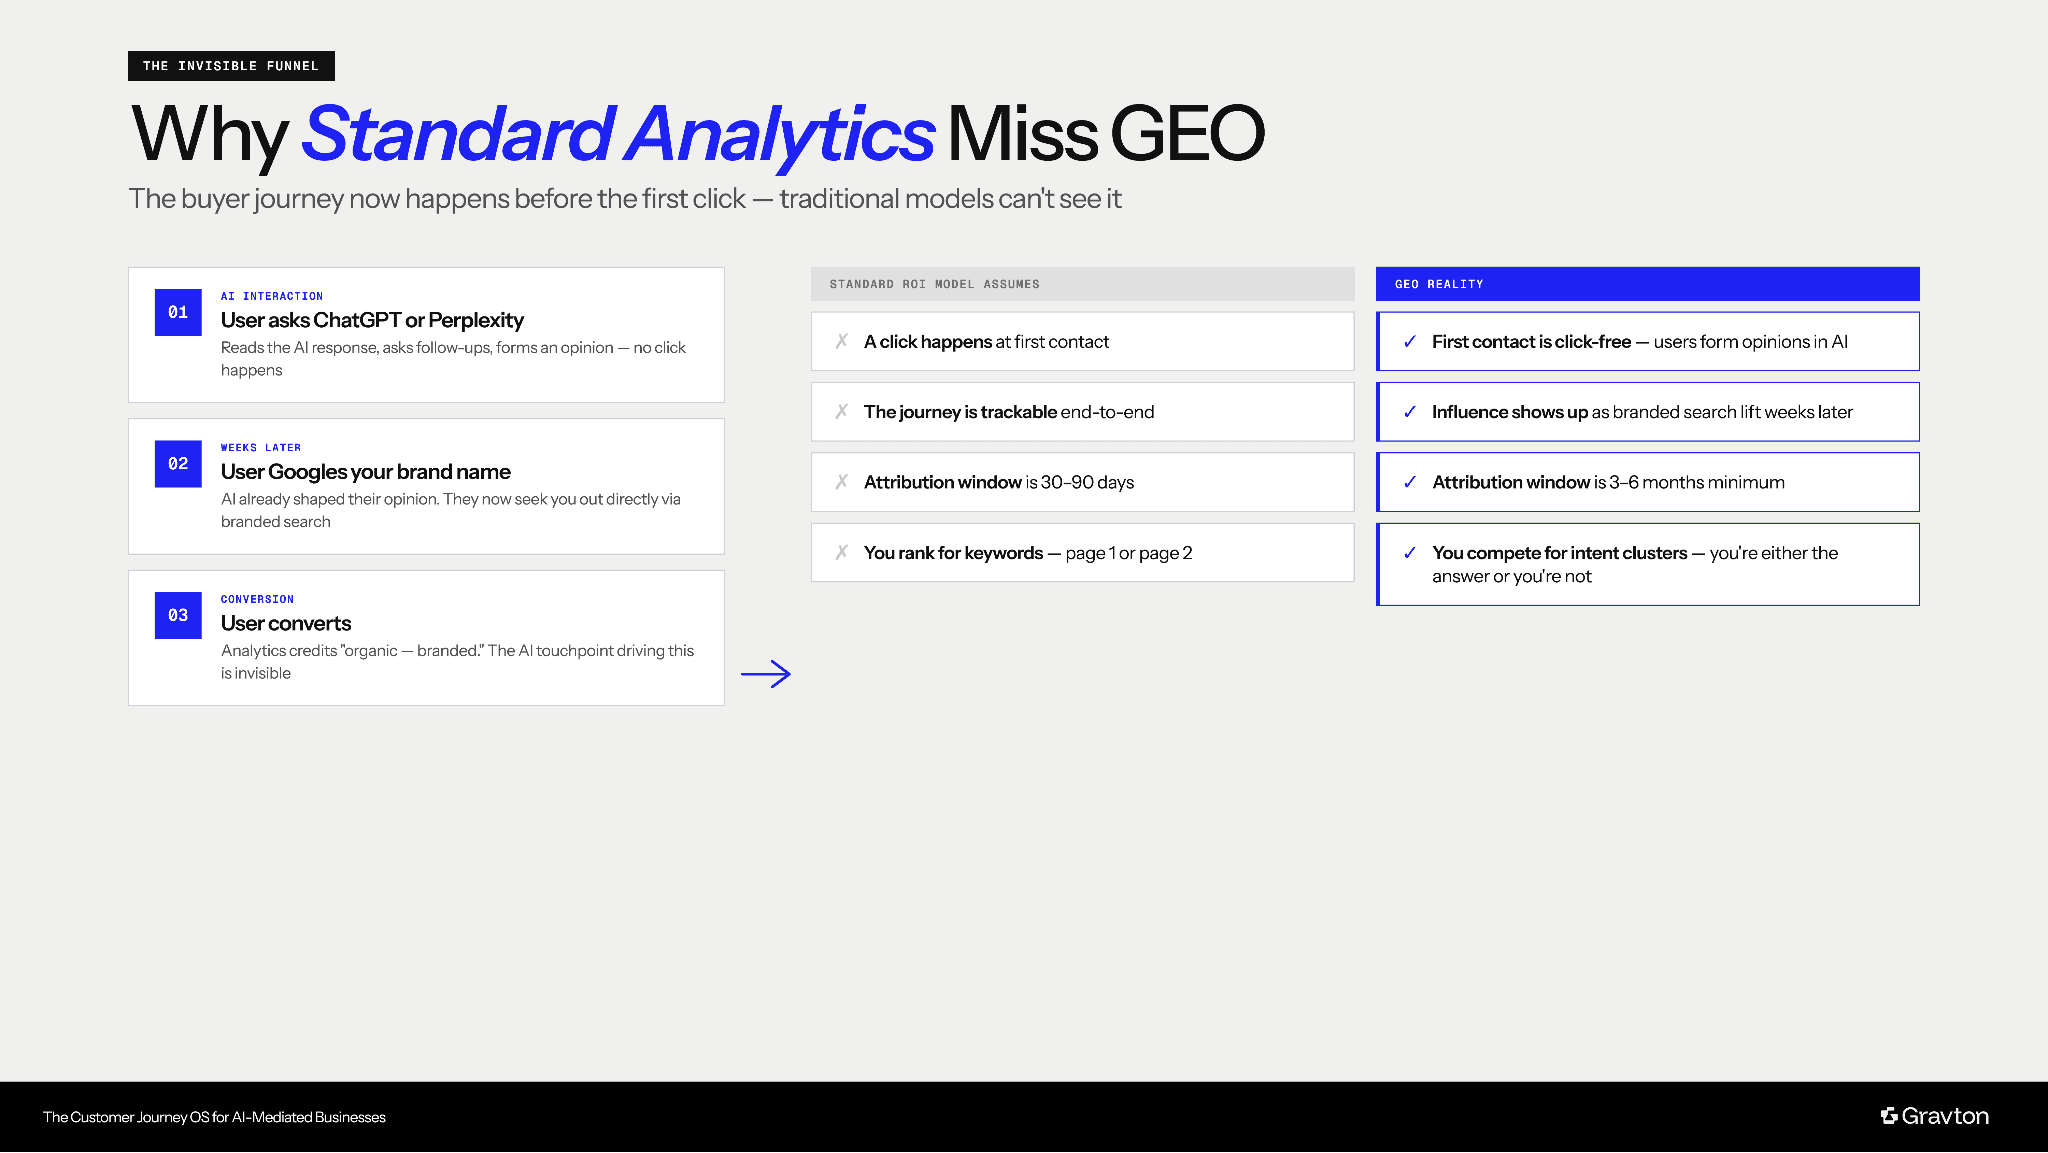
Figure 1: Standard analytics miss GEO.
The four types of return from GEO
There are four types of return from GEO, and they appear in sequence:
Table 1: The four types of return from GEO.
Return | What It Is | Where You See It | How Long It Takes |
Citation share | The percentage of relevant prompts where your brand is named or your domain is cited in the answer | Prompt monitoring tools (Gravton Labs, Profound, manual testing) | 2-8 weeks after content ships |
Branded search lift | Increase in people Googling your brand name directly | Google Search Console, branded keyword tracking | 6-12 weeks |
Assisted conversions | Deals that touched an LLM somewhere in the journey, even if the last click was branded search or direct | CRM with self-reported attribution, multi-touch models | 3-6 months |
Direct LLM traffic | Visitors who actually click through from a ChatGPT or Perplexity citation | UTM-tagged links in cited pages, referrer analysis | Immediate but small |
Most teams focus on direct traffic first because it is easy to measure, which is misleading. Direct traffic is the smallest part of the GEO impact. The real value lies in influence across the funnel.
How to measure GEO ROI: A step-by-step framework
A comprehensive framework is needed to measure the GEO ROI, transforming abstract exposure into measurable impact.
1. Define GEO key performance indicators (KPIs)
Start with defining what success looks like.
Common KPIs:
AI-driven leads
Citation shares on key prompts
Branded search growth
AI influenced pipeline
Examples:
→ Increase AI-driven leads by 20%
→ Grow branded search volume by 15%
2. Benchmark your current AI visibility
Establish a baseline before optimization.
Track:
How often does your brand appear in AI responses
Which prompts trigger visibility
Your position in responses
Examples:
→ Appears in 10% of relevant AI queries
→ Generates 50 AI-influenced leads per month
3. Allocate attribution
Since AI interactions often don’t lead to immediate clicks, attribution must extend across the funnel.
Map influence across three stages:
Awareness: AI mentions and impressions
Consideration: Branded searches
Conversion: Leads and deals
Examples:
→ 1,000 users see your brand in AI responses (awareness)
→ 200 search brands later (consideration)
→ 40 signs up for a demo (conversion)
Understanding how buyers phrase prompts before they reach a vendor can help explain which visibility improvements contribute most to pipeline outcomes.
4. Implement tracking systems
You need indirect tracking methods to capture AI influence
Use:
branded search monitoring
CRM attribution
UTM tagging
Prompt tracking tools
Examples:
→ Branded searches grow from 2,000 to 2,600 per month (+30%)
→ AI-influenced traffic increases by 25%
5. Analyze performance against KPIs
Evaluate how changes in AI visibility affect business outcomes.
Look for:
Correlation between citation share and leads
Growth in branded search
Increase in conversion rates
Examples:
→ Leads grow from 50 to 75 per month (+50%)
→ Conversion rate improves from 8% to 11%
6. Optimize and iterate
GEO strategy is iterative. Continuously refine your strategy.
Key actions:
Target high-intent prompts
Improve content structure for AI readability
Increase coverage of key intent clusters
Examples:
→ Citation share increases from 10% to 22%
→ Optimized content earns 2× more citations
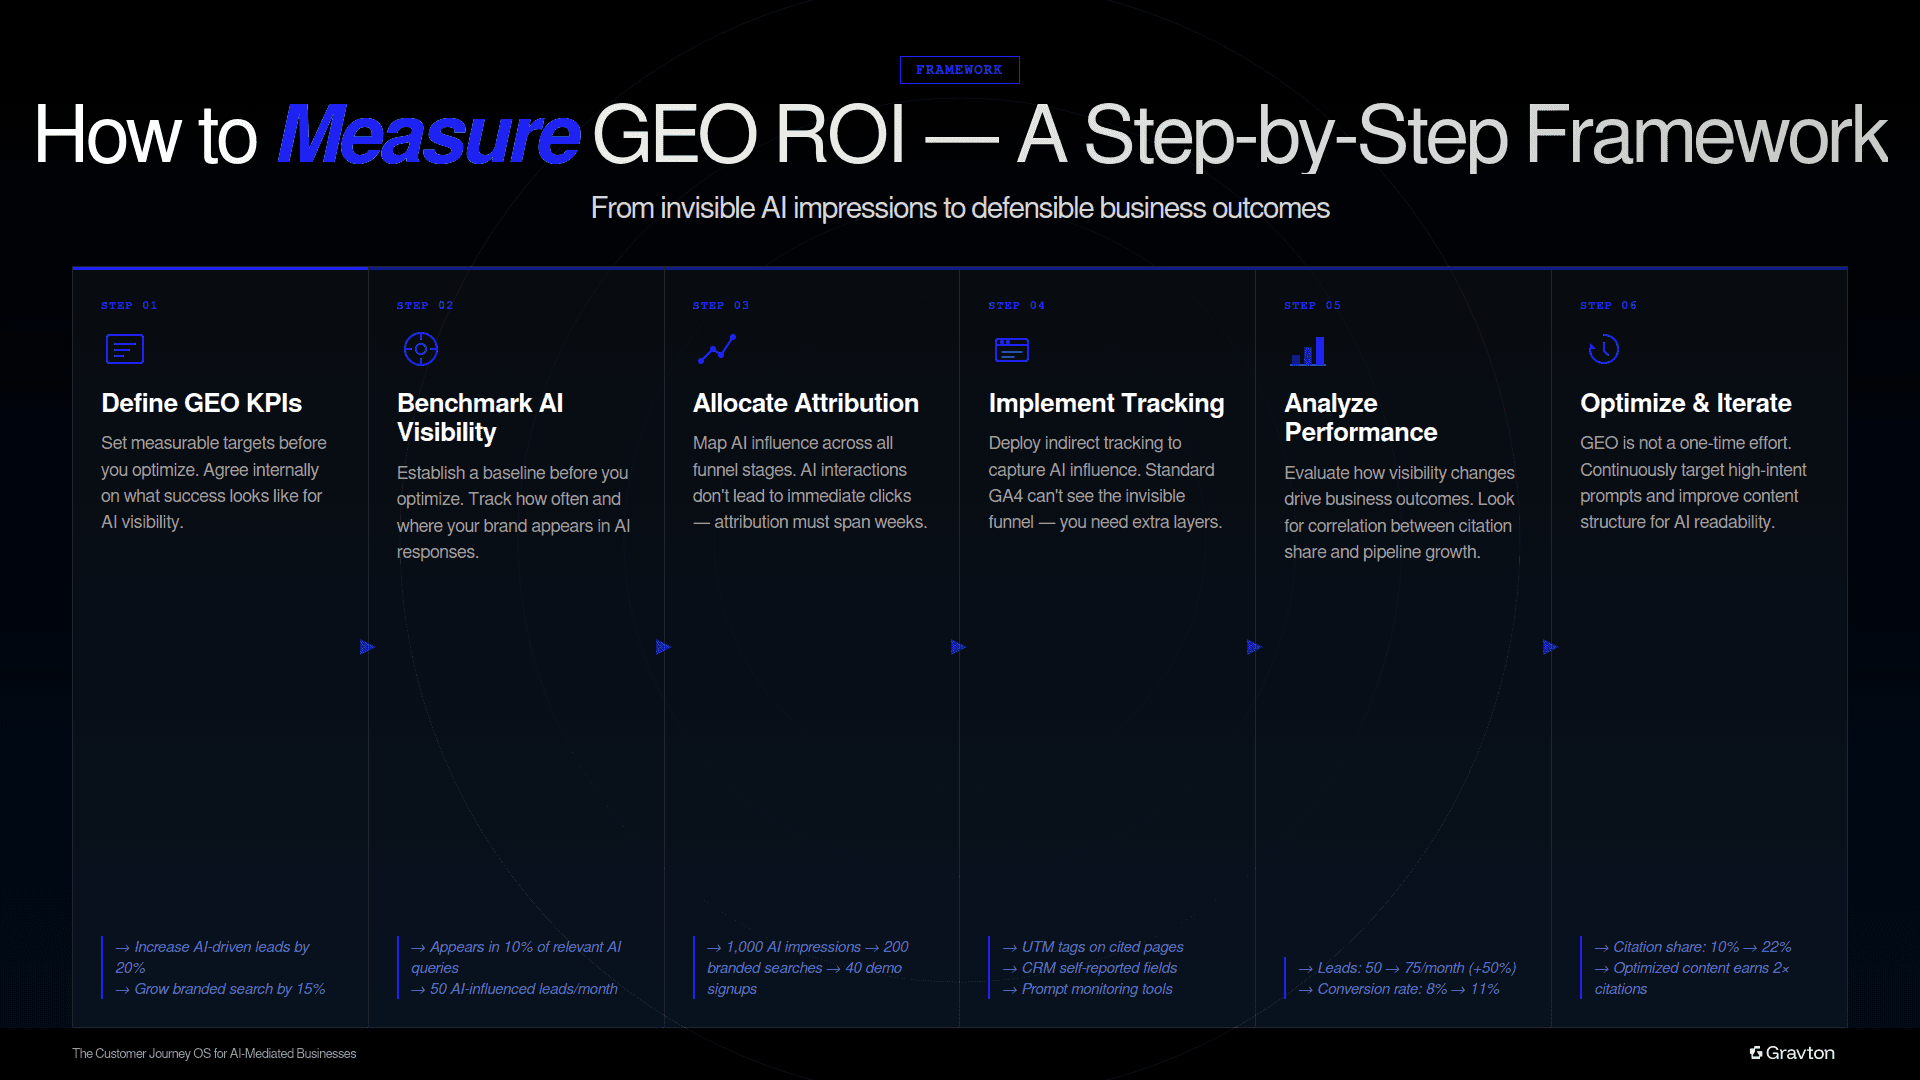
Figure 2: A step-by-step framework to measure the GEO ROI.
How do you calculate GEO ROI?
Here is the math, written so you can plug your own numbers in.
GEO ROI = (Influenced pipeline × close rate × average deal size − program cost) ÷ program cost
Three of the four inputs are familiar. The new one influences the pipeline, the number of opportunities that touched a GEO surface somewhere in their journey. You get these number two ways:
Direct: count opportunities where the self-reported source field names an AI tool.
Modeled: take the lift in branded search volume since the program started, multiply by your historical branded-search-to-opportunity conversion rate and treat that as the influenced pipeline.
The modeled number will be larger than the direct number, and that is correct. Self-reporting always undercounts because buyers forget where they first heard about you. Most teams report a blended figure, direct as the floor, modeled as the ceiling, and a midpoint as the working estimate.
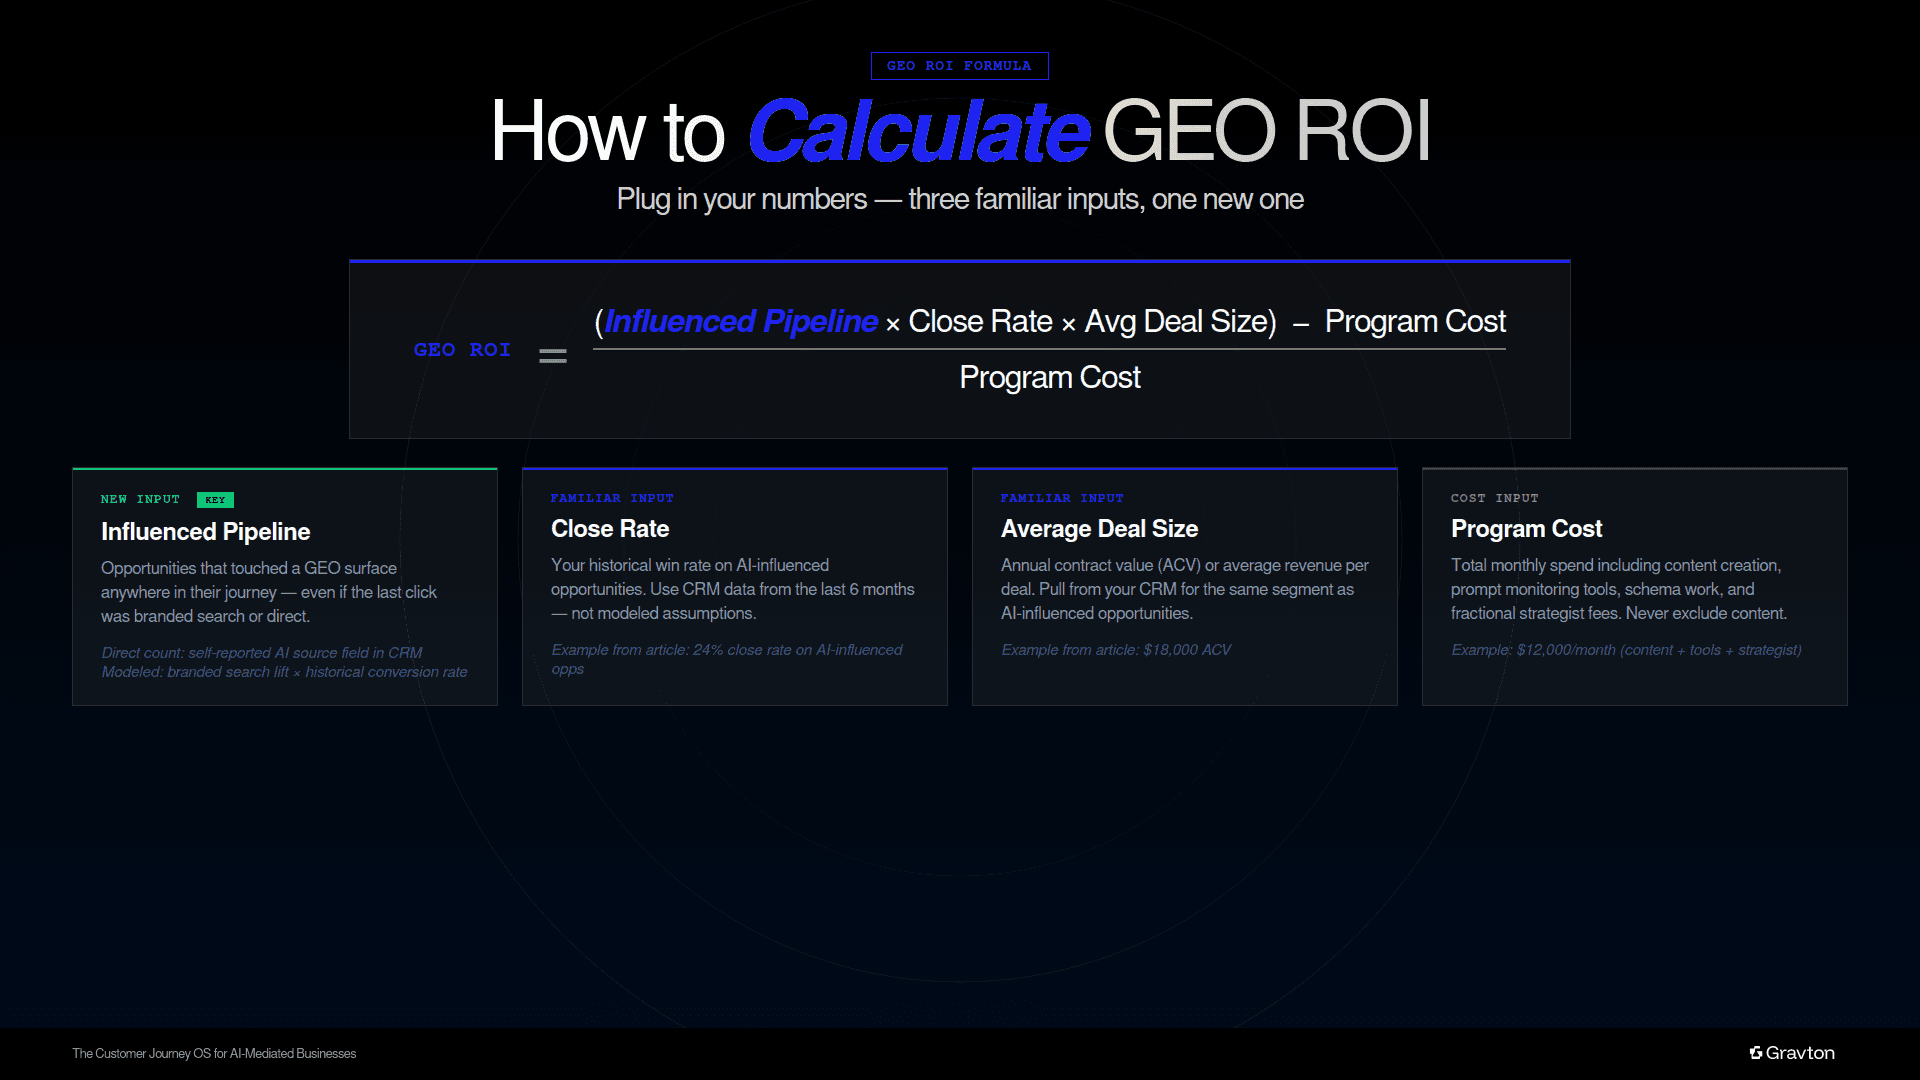
Figure 3: Formula to calculate GEO ROI.
Two things to watch
Cost has to include content:
Program cost is not just what you pay a tool or an agency. It includes the content you produce specifically to win citations, the comparison pages, the structured FAQs, the schema work, the third-party placements. If you leave content out, your ROI number will look better than it is and you will underinvest in the part that actually moves citation share.
Payback periods are real and they are not short:
A mid-market program running at $10,000 per month typically takes four to seven months to pay back. Citations take two months to start moving. Branded search takes another month or two to follow. The first opportunities attributable to GEO show up in the pipeline a month after that. If your CFO expects payback in 60 days, the conversation needs to happen before the program starts, not after.
Common mistakes when measuring GEO ROI
Many mistakes can lead to misinterpretation in GEO performance.
1. Ignoring content costs
Program cost is not limited to tools or agency fees but also includes content creation. Program costs include content creation, such as structured FAQs, schema markup, and third-party placements, which drive citation share. Excluding these costs inflates ROI. This leads to underinvestment in the areas that actually drive results.
2. Relying only on direct traffic
Direct LLM traffic accounts for only a tiny fraction of GEO's impact. Measuring ROI solely on this metric misses GEO's broader influence on awareness and consideration.
3. Using short attribution windows
Traditional attribution models typically look at 30-90 day windows. GEO influence appears later, often as branded search lift 2-3 months after an AI interaction. Short windows undervalue GEO systematically.
4. Expecting immediate ROI
GEO is not a short-term channel. Citation share may take 1-2 months to improve, followed by branded search growth and pipeline impact. Most programs take 4-7 months to show meaningful ROI.
5. Measuring GEO like SEO
GEO does not operate on keyword rankings. It competes for intent clusters and presence within AI responses. If your brand isn't included in responses, it doesn't exist in that query space.
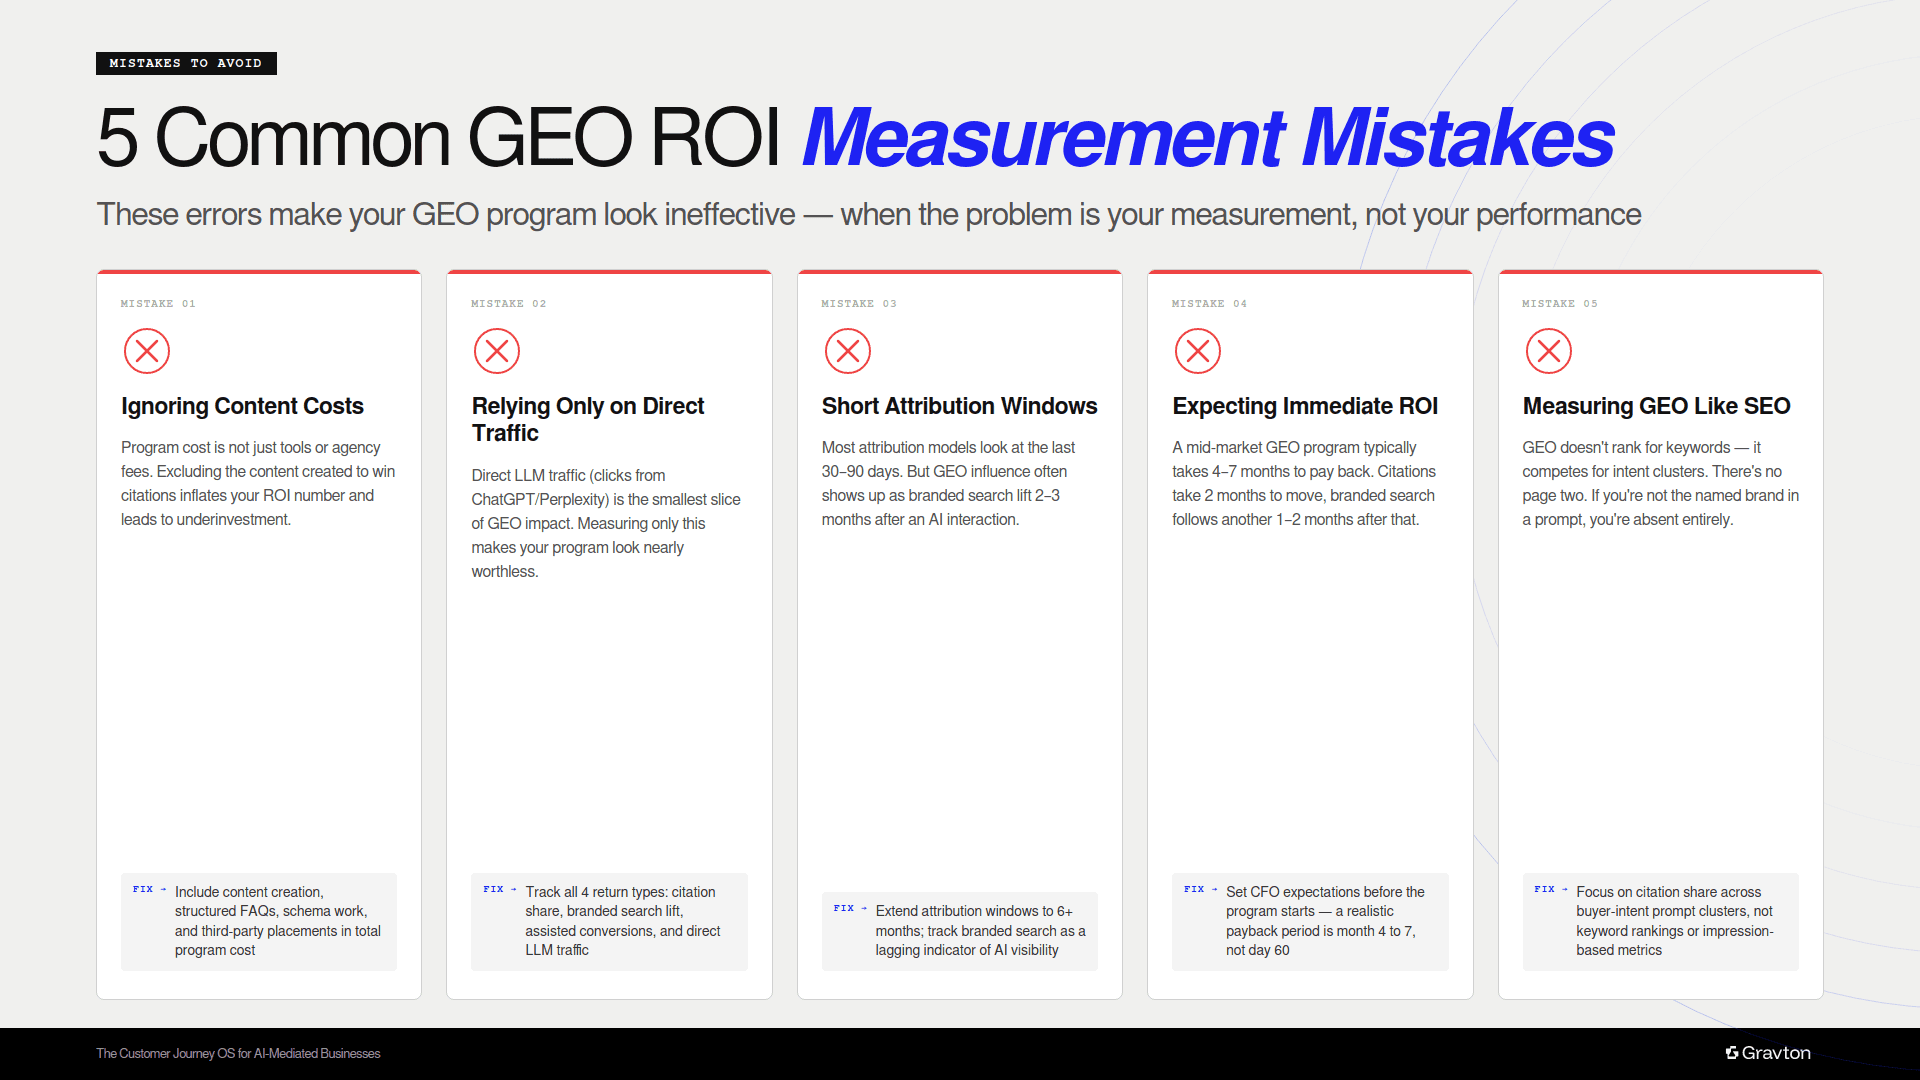
Figure 4: Five common mistakes when measuring GEO ROI.
Example: connecting GEO to ROI
A B2B SaaS company in the project management space spends $12,000 per month on a GEO program, specifically, content, prompt monitoring, schema work, and a fractional strategist. After six months:
Citation share on their top 40 buying-intent prompts has moved from 8% to 27%.
Branded search volume is up 22% over the pre-program baseline, with no other campaign activity that would explain the lift.
The "where did you hear about us" field on demo requests names an AI tool 14% of the time, up from 3%.
The sales team has closed 11 deals in the last quarter in which the buyer mentioned ChatGPT or Perplexity during discovery calls.
Here is how that turns into a number.
Table 2: Example of calculating ROI from GEO.
Input | Value | Source |
Average deal size (ACV) | $18,000 | CRM |
Close rate, AI-influenced opportunities | 24% | CRM, last 6 months |
AI-influenced opportunities per month, direct count | 9 | Self-reported source field |
AI-influenced opportunities per month, modeled | 16 | Branded search lift x historical conversion rate |
Working estimate (midpoint) | 12 | Average of direct and modeled |
Program cost per month | $12,000 | Content + tools + strategist |
Monthly influenced pipeline: 12 opportunities × $18,000 = $216,000. Monthly influenced revenue: $216,000 × 24% close rate = $51,840. Monthly ROI: ($51,840 − $12,000) ÷ $12,000 = 3.3× Payback: the program covered its cost in month five.
Here are a few key points to note. The 3.3× return sits lower than the headline numbers that GEO vendors typically publish, and this choice is intentional. This figure is derived from a midpoint rather than a ceiling and considers content cost as part of the program. It uses a real close rate rather than a modeled one, making it defensible to a CFO. In contrast, a 12× return based on impressions and assumed conversion rates will not hold up under scrutiny.
Another important observation is that the increase in citation share from 8% to 27% drives most of the results, focusing on a carefully selected set of 40 prompts. The team chose not to compete in every area; instead, they focused on prompts where buyers actually make decisions. This principle stands as the most crucial operating guideline in GEO, which is why the framework starts with intent clusters.
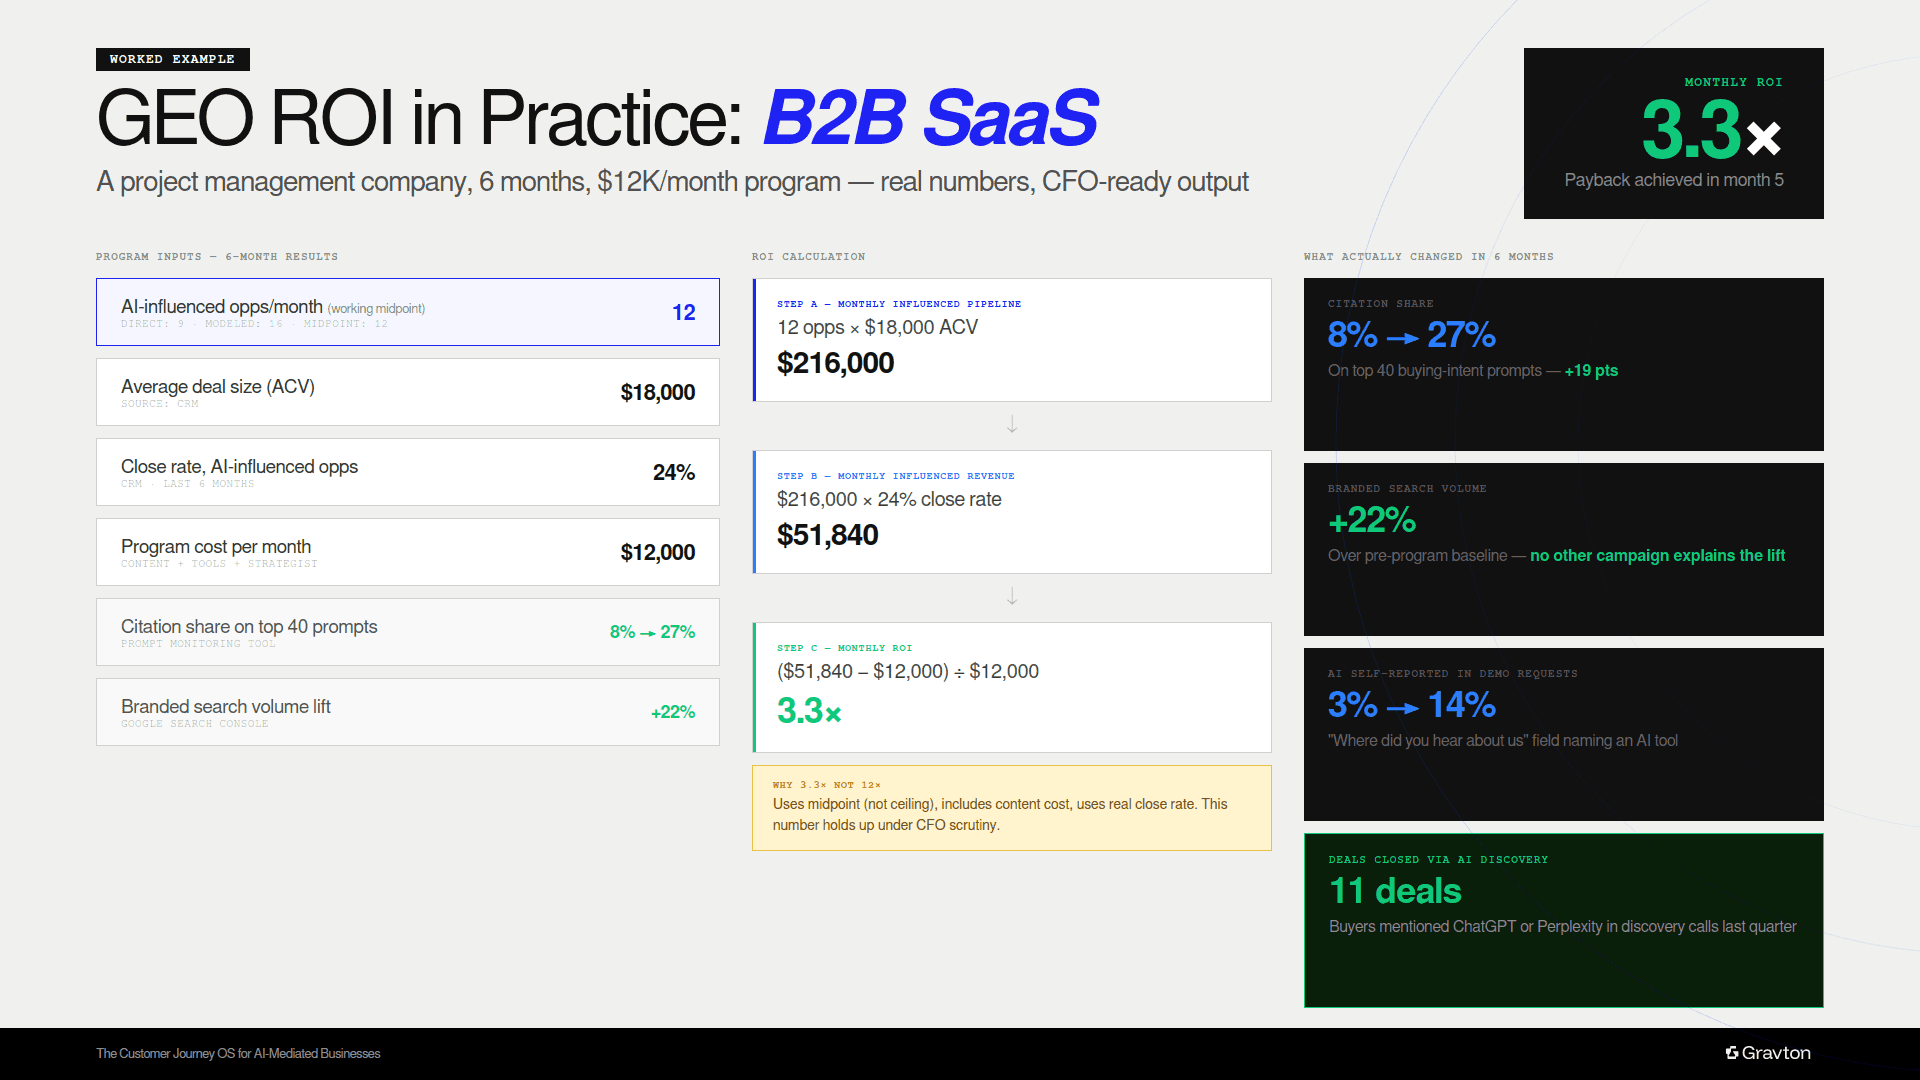
Figure 5: An example of GEO ROI in practice.
FAQs on how to measure ROI from GEO
What does it mean to measure ROI from GEO?
To measure ROI from GEO, you need to connect AI visibility metrics like citation share and branded search lift to business outcomes such as leads, pipeline, and revenue.
Why is measuring ROI from GEO difficult?
GEO ROI is harder to measure because most interactions happen without clicks. Users often engage with AI platforms, form opinions, and convert later through branded search, making traditional attribution models incomplete.
What metrics are most important to measure ROI from GEO?
Key metrics include citation share, branded search growth, AI-influenced pipeline, assisted conversions, and direct LLM traffic. Together, these help quantify how AI visibility translates into revenue.
Can you measure ROI from GEO without direct traffic data?
Yes. Direct traffic is only a small part of the GEO impact. Most ROI comes from indirect signals, such as increased branded search and an influenced pipeline, which can be modeled and tracked over time.
What is the formula to measure ROI from GEO?
ROI from GEO is calculated by connecting AI-driven influence directly to revenue outcomes.
(Influenced pipeline × close rate × average deal size − program cost) ÷ program cost.
How long does it take to measure ROI from GEO?
Typically, you will start seeing meaningful ROI within 4-7 months. You’ll first notice an improvement in citation share, followed by branded search lift, and then pipeline and revenue impact.
How do you attribute conversions when measuring ROI from GEO?
Attribution is done using a blended approach:
Direct: self-reported sources mentioning AI tools
Modeled: branded search lift × historical conversion rates
A midpoint between the two provides a realistic estimate.
What tools help measure ROI from GEO?
Common tools include prompt tracking platforms, Google Search Console for branded search, CRM systems for pipeline attribution, and UTM tagging for direct AI traffic.
What role does branded search play in measuring ROI from GEO?
Branded search is a critical indicator of GEO success. It reflects increased awareness driven by AI visibility and serves as a bridge between AI interactions and conversions.
What mistakes should be avoided when measuring ROI from GEO?
Common mistakes include ignoring content costs, relying only on direct traffic, using short attribution windows, and expecting immediate ROI within 1-2 months.
Win your AI search demand universe
Understand how AI platforms influence buying journeys that standard attribution models can't see and where competitors are generating returns from a funnel you haven't started measuring.
VISIBILITY & CONTENT STRATEGY